Highlights of our recent cosmic ray measurement
On this page we will interpret the results of the analysis described on the analysis page. We will demonstrate two important physical phenomena.
- Time dilation due to Special Relativity.
- The Bragg Peak in energy deposition by charged particles.
Is it not amazing that we can demonstrate such important physics with a piece of scintillating plastic, a phototube, and a bunch of electronics?
Cosmic mu-meson decay time distribution proves Special Relativity
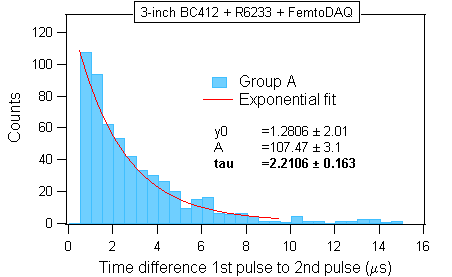
Figure C.1. Measured interval distribution between the leading and the trailing pulses after removing the random background. The measured mean lifetime tau is in good agreement with the official value 2.197 microseconds.
The exponential distribution shows that the mu-meson is unstable. On the average, it lives for only 2.2 microseconds, as shown in the plot. According to classical Newton mechanics, we should not be able to see these mesons produced tens of kilometers above our heads. If they were moving at the speed of light, half of them would disappear every 456 meters. Only 1/1000 would survive 4.6 kilometers, and one milionth would survive 46 kilometers. It means we would not be able to record them in our detector.
The paradox is explained by the theory of special relativity, which says that time is diluted for the mu-meson because of its speed. From the mu-meson perspective "our 2.2 microseconds" last much shorter than for us, what enables the meson to reach the detector before the particle ceases to exist. The details are elaborated on the time dilation page on the web.
As soon as the meson stops, its internal clock is no longer diluted. The meson obediently disappears from existence with the prescribed mean lifetime 2.2 microseconds, as demonstrated in the plot that we have measured.
Mu-meson pulse height distributions demonstrates the Bragg Peak
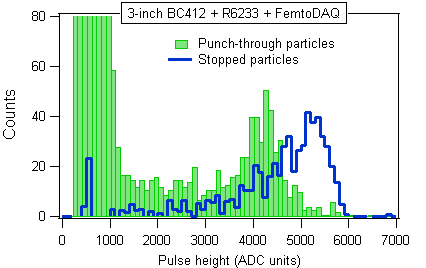
Figure C.2. Pulse height histograms of particles punching through the detector (green solid bars) and those that stopped in the detector (solid blue line).
The green bar histogram was produced by those mesons which have not decayed within the detector. The green bar histogram can be interpreted as follows:
- The relativistic mu-mesons (the ones that punch through) leave constant energy per unit length in plastic. Such particles are commonly named minimum ionizing particles (MIP's).
- Due to the constancy of energy loss per centimeter, the shape of the energy histogram directly reflects track length distribution in plastic. (The histogram reflects the geometry of the detector.)
- Most mu-mesons arrive vertically from the zenith. A minority arrive at an angle.
- The particles which vertically punched through the cylinder produced the peak around PH = 4,000.
- The particles with "grazing tracks" going through the sides of the cylinder produced the low energy tail. (These tracks were shorter.)
More information on stopping power can be found on page 4 in Passage of particles through matter by Particle Data Group. Figure 21 in that reference shows that mu-meson stopping power is roughly constant over three orders of magnitude of momentum, from 0.1 up to 100 GeV/c.
We now turn attention to those particles that stopped in the detector (blue line histogram). These particles must have been slower than MIP's, or otherwise they would not stop. Yet, the energy deposition by the stopped particles was larger. This phenomenon is explained by the same Figure 21 by Particle Data Group. Slow mu-mesons with momenta between 0.1 to 10 MeV/c lose ~100 more energy per unit length than the high momentum particles. This phenomenon was discovered in 1903 by William Henry Bragg and hence it bears his name. More information can be found in Wikipedia in the article on the Bragg_peak. The phenomenon is practically useful for particle therapy of tumors.
Please tell us what you think
We hope that you found our investigations both interesting and entertaining. We invite the feedback from anyone who is interested in either pursuing such investigations or in suggesting improvements and refinements to what we have done.
Updated March/01/2016.
© 2016 by CosmicRayNet.