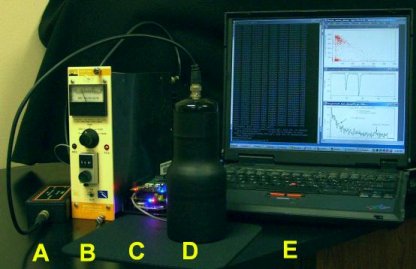
Figure P.1. Experimental setup with the BC412 detector connected to FemtoDAQ.
Our goals:
Fast plastic scintillator is a classic active medium for cosmic ray studies. We used a compact plastic detector manufactured by iRad (see the detectors page for details). The detector was composed of a 3" diameter, 2.125" high cylinder made of fast plastic scintillator BC412 coupled to a vacuum photomultiplier type R6233 by Hamamatsu. The experimental setup is shown in the photograph. The legend: (A) HV / signal splitter box. (B) HV supply. (C) FemtoDAQ. (D) Plastic detector (3 inch BC412 plus the phototube). (E) FemtoDAQ control laptop.
Both the single-pulse and multiple-pulse events were identified in real time by the field programmable gate array (FPGA) which is the centerpiece of the FemtoDAQ unit. In order to provide the representative sample of random coincidences, we programmed the coincidence window to 20 microseconds, which was ten times the mu-meson lifetime. We recorded every waveform with more than one pulse in the window. We programmed FemtoDAQ to record only one out of every 500 waveforms with a single pulse within the window.
In the first run FemtoDAQ recorded 1,326 events overnight with the detector in the horizontal position. Out of these, 222 events were mu-meson decay candidates. In the next run lasting five days with the detector standing upright (as shown in the photograph), FemtoDAQ detected and processed 3,512,000 events. It recorded 8,551 waveforms, out of which 1,531 were the decay candidates. The number of recorded "non-candidates" was (8,551-1,531) = 7020. The recorded file size was 53,704 kB.
The waveforms were recorded in plain ASCII format. There were 2048 samples per waveform, concatenated into one big event file which was stored on the FemtoDAQ internal solid state disk. After the experiment we copied the file to the Windows laptop. We used IGOR 6.34 to process the event file. The framework for event processing is explained on the offline analysis software page.
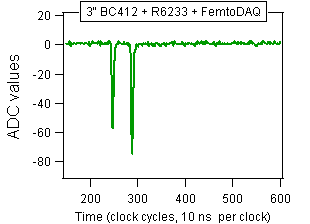
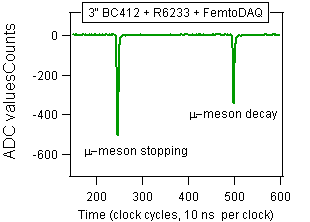
Two examples of double-pulse waveforms are shown below. The leading pulses were presumably due to mu-mesons stopping within the detector volume. The trailing pulses were (again presumably) due to the electrons emitted in the mu-meson decays. The presumption can be checked by collecting very many such waveforms and plotting the time differences between the pulses. The characteristic of the mu-meson decay is its 2.2 microsecond mean lifetime, which should become visible in the decay time histogram.
In addition to the time intervals between the pulses, the waveforms also provide precise information concerning pulse amplitudes and areas under each pulse. This information will be used to identify and remove the random background events.
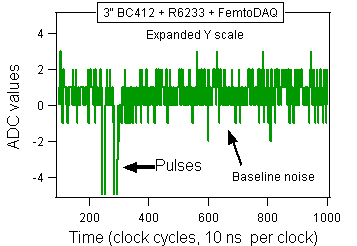
The next figure shows the first waveform expanded around the baseline. The RMS noise is close to the hardware limit of the ADC chip. The pulse shape is excellent, without any indication of the overshoot following the trailing edge. This kind of performance qualifies FemtoDAQ for the most demanding research applications.
The analysis of the recorded data is described on the data analysis page.